
Prep today, plan tomorrow
We’ve got some tips on how to start building a financial plan that suits you. Try breaking down your goals into short-term, mid-term, and long-term.

Savings made easy
- Short-term goal - build a rainy-day fund.
- Mid/long-term goal - explore investing.
- Long-term goal - it’s never too early to think about your pension.
We see short-term as less than 5 years, mid/long-term as 5 to 10 years and long term as 10 years plus.
Live your best life, with one eye on the future
Where did the time go? One minute you were beginning to hurtle down into your career rabbit hole. Now you might be juggling travelling, getting on the property ladder, starting a family, or adding to it…
Right now, everything is an opportunity. Even managing your money. Young Britons are showing more interest in their finances and looking at ways to increase their wealth, according to recent research from professional services firm, EY.
Chances are, you’re looking for a bit of help in that area. So, we’ve pulled together a few hacks for trying to achieve short, mid, and long-term goals to help you live your best life now, while helping to secure your financial future.
Investment's 10-year track record:
This graph shows a comparison of savings and investments over 10 years.
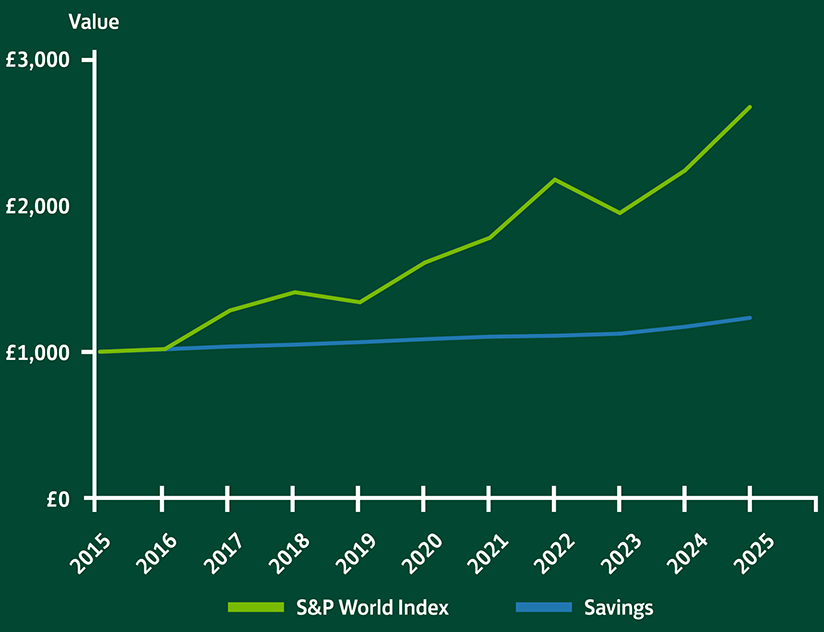
If you’d invested £1,000 in a fund tracking the S&P World Index (it tracks medium to large companies across 24 developed markets) in 2015, it would have been worth £2,659 in January 2025. Whereas £1,000 kept in a typical savings account would be worth £1,229 in January 2025.
Source:
(Savings) MoneyFacts, 12m Fixed Non-ISA rates, January 2025.
(Investments) S&P Dow Jones Indices, S&P World Index (GBP). Excludes fees. Past performance is not a reliable indicator of future performance. You can see a breakdown of these figures here.
Past performance is not a reliable indicator of future performance. Please remember that the value of investments and the income from them can fall as well as rise, and you may get back less than you invest. If you’re not sure about investing, seek financial advice. There will normally be a charge for that advice.
Our Save & Invest calculator in the app shows you how your money might perform, depending on whether you save or invest, or both.
Investing needn’t be complicated, but you should be OK with tying up your money for at least five years to make it worth it.
Making the jump into investments can be daunting at first, so we’ve created a wealth of handy info in our app to help you understand more. Our ‘What is investing tool’ in the app is your go-to online guru.
Then if you’re ready to go, our Ready-Made Investments can get you started, or you can choose your own investments through our Share Dealing Account.
How to achieve the retirement you want, if you started pension contributions now
|
Age |
25 |
30 |
35 |
40 |
45 |
50 |
|---|---|---|---|---|---|---|
|
Age Monthly pension contributions required for minimum £14,400 a year in retirement |
25 £110 |
30 £135 |
35 £165 |
40 £205 |
45 £265 |
50 £360 |
|
Age Monthly pension contributions required for minimum £31,300 a year in retirement |
25 £750 |
30 £900 |
35 £1,115 |
40 £1,405 |
45 £1,805 |
50 £2,450 |
|
Age Monthly pension contributions required for minimum £43,400 a year in retirement |
25 £1,200 |
30 £1,450 |
35 £1,800 |
40 £2,225 |
45 £2,880 |
50 £3,915 |
-
State Pension
We've assumed you could receive a full state pension entitlement of £11,502 per year if at the qualifying age. We remove this from the calculation if you are under the qualifying age.
You can get a personal State Pension Forecast here.
Income Tax
We've used a basic English income tax calculation, which assumes you will not receive any additional income at retirement.
Tax treatment depends on your individual circumstances.
Your circumstances and tax rules may change in the future.Contributions
The tool assumes that contributions will be made every year including the year of retirement, with monthly contributions annualised for calculation purposes. With the results showing any contributions ceasing before age 75.
Growth Rate
We've assumed a growth rate of 5% per year to your pension value, annualised for calculation purposes.
Inflation
We've assumed a 2% inflation rate in line with current FCA guidance, annualised for calculation purposes.
Charges
We've assumed a charge of 0.7% per year, annualised for calculation purposes.
Tax-Free Lump Sum
We've assumed that a 25% tax-free lump sum will be taken out of your pension, and the full amount of projected pension will be taken as income. However, it is possible to amend this percentage.
Retirement Living Standards
We use estimations from the PLSA/Loughborough University Retirement Living Standards for a single person.
Withdrawal rate
We've assumed that you are taking a guaranteed income for life, also known as an annuity at 4% per year of the projected funds. This will be after any tax-free cash up to 25% has been taken.
Pension allowances
We've not assumed any tax charges from exceeding allowances such as the annual allowance or money purchase annual allowance.
Net and Gross Figures
All of the figures we provide are net (i.e. after deduction of income tax) except for the gross monthly pension contribution figure.
Important information – This article isn’t personal advice. If you’d like to discuss any of the topics covered here, including the actions for your individual circumstances, please contact your financial adviser. If you do not have a financial adviser, you may be able to access one with Lloyds Wealth (fees and eligibility criteria apply). Unbiased is a service that finds a local adviser based on your requirements. You can also find mortgage brokers, accountants, and solicitors on Unbiased.
The contents of this page are accurate as of 10/01/2025. Our views and references to pensions, tax, investment, or their rules, may have changed since then.